
A plain-language summary of a calibration exercise behind the working paper. Downloads: animation (MP4) · simulation scripts.
Doug Westmoreland (project lead: direction and review) and Claude, Anthropic (research and analysis)
Version 1.0, 2 November 2026. Written for readers without a physics background. It summarises a longer technical report; the scripts behind every number are linked at the end.
In short
- Why we did this. Our tests of Harold Aspden’s aether ask how fast a push travels through his grid of charged particles (quons). Before trusting the computer tools on an imagined medium, we tried them on real matter, where the answer is known: the speed of sound.
- The rule. Every force law took its numbers from measurements other than sound speed. So each simulated speed is a genuine prediction, not a fit.
- What came out.
- Argon and helium gas: within about 1% of measurement (323 against 323.5 m/s; 1,024 against 1,028 m/s).
- Liquid argon: 858 against 840 m/s, about 2% fast, which is typical for the simple force law used.
- Rock salt: every one of its six wave speeds within 1–2%.
- Liquid sodium: the simplest estimate was 2,925 m/s, 16% high. Adding the electrons’ quantum behaviour, the ions’ cores and the heat brought it to 2,678 m/s, about 6% high against the measured 2,508–2,531 m/s.
- What it means for Aspden. The tools work. And two lessons carry over to any model of the aether (section 4).
1. How we timed the waves
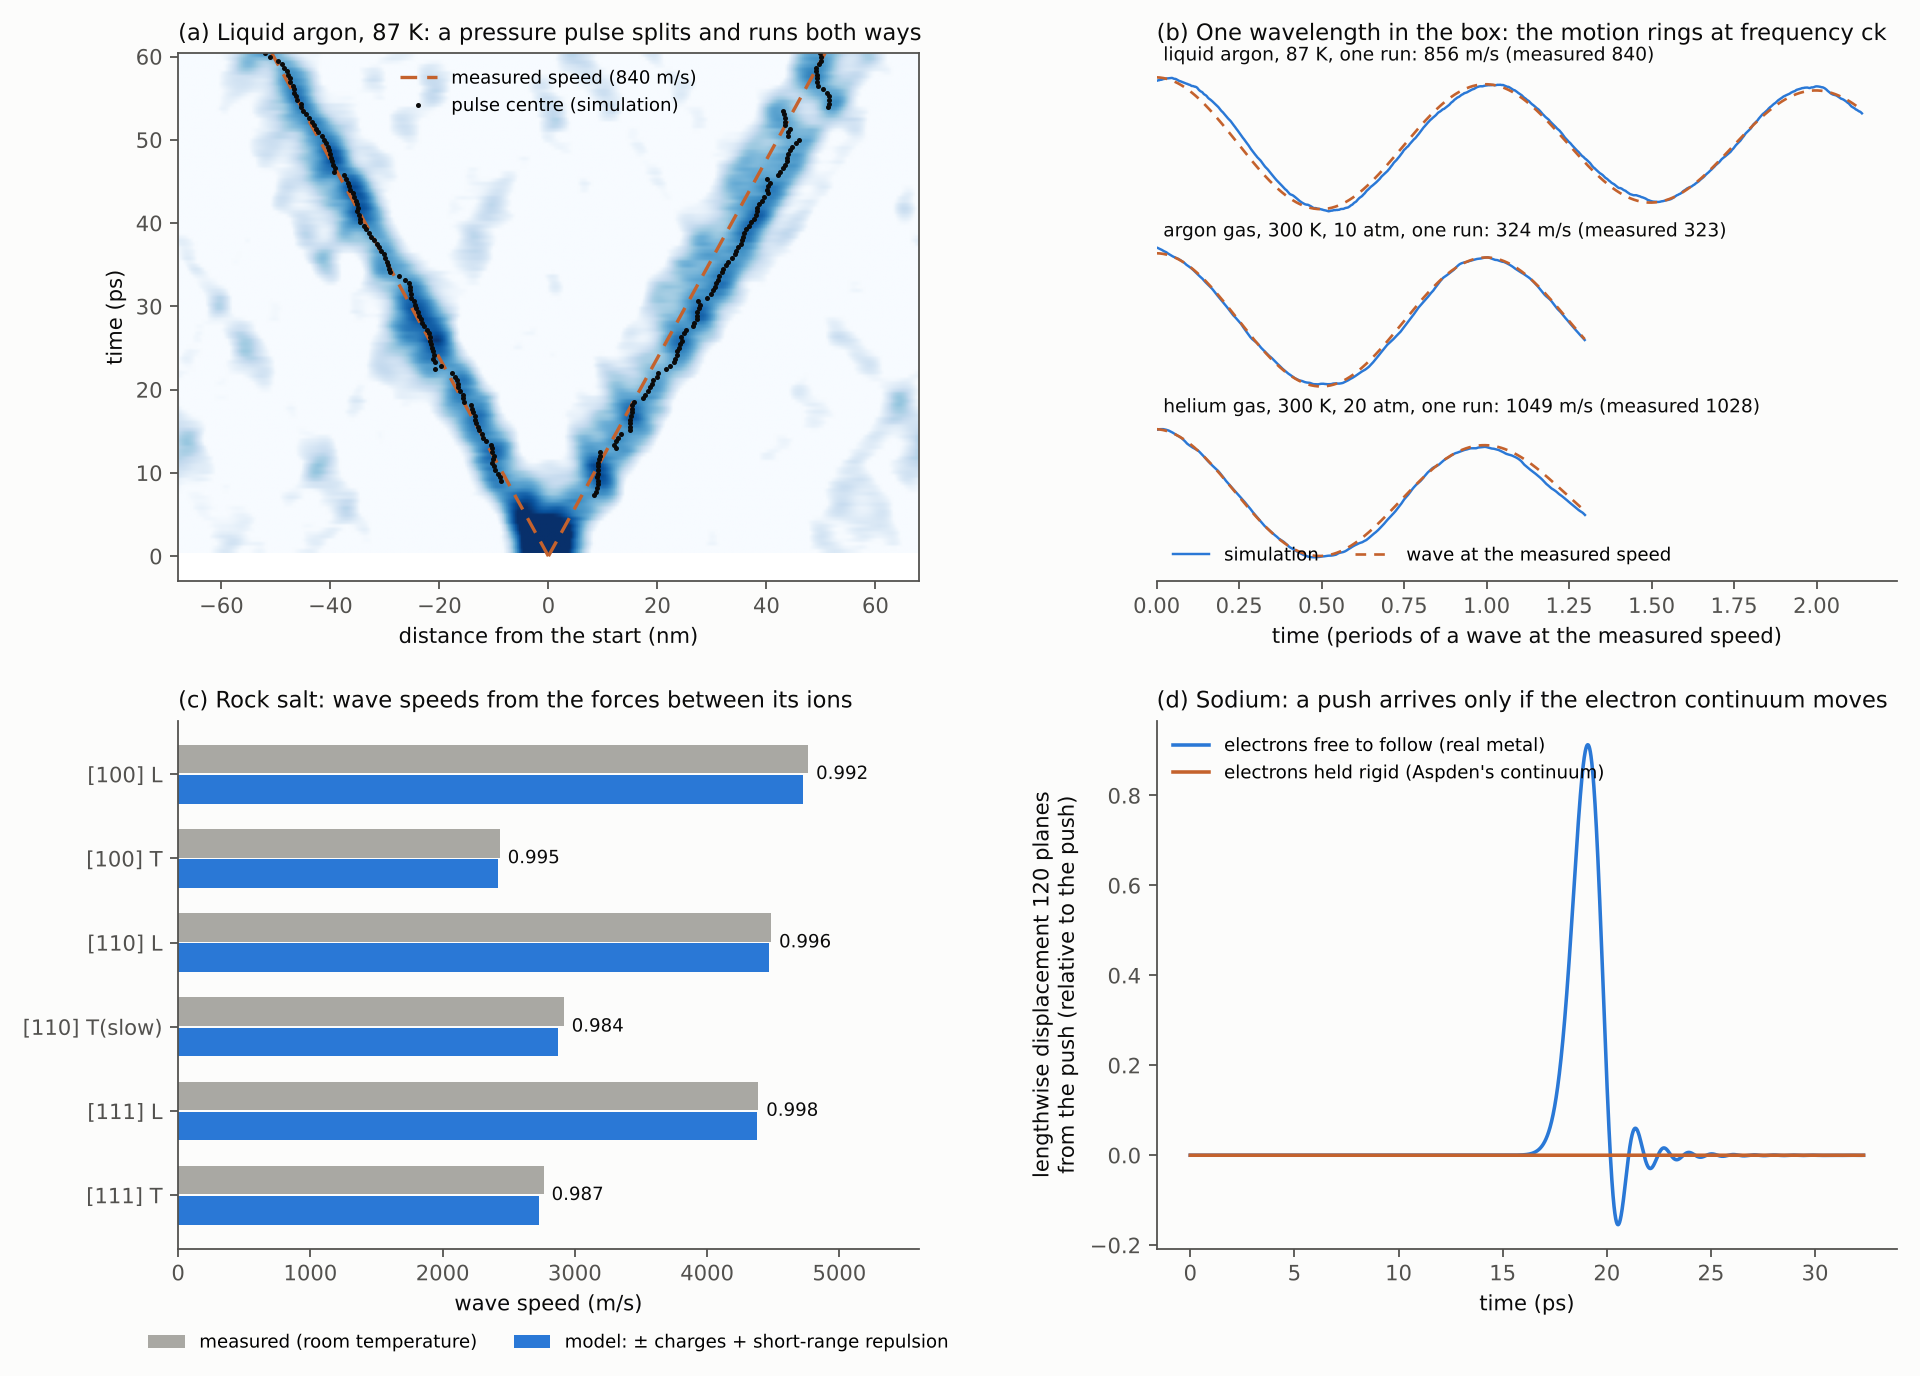
Figure 1. (a) Liquid argon: a pressure pulse started at the centre splits and runs both ways; the dashed lines show the measured speed. (b) One whole wavelength in the box, for liquid argon, argon gas and helium gas: the simulated motion (blue) against a wave at the measured speed (orange). (c) Rock salt: the model’s six wave speeds against measurement. (d) Sodium: a push sent 120 atomic layers along, with the electrons free to follow (blue: it arrives) and held rigid, as Aspden’s continuum is (orange: nothing arrives).
- A box of atoms. Each simulation follows thousands of atoms, moving under the forces between them, at the measured temperature and density.
- Two clocks.
- In a liquid, a small push at the centre of a long box splits into two pulses, and we time them.
- In a gas this fails, because the atoms’ random thermal motion swamps a small pulse. Instead we start the box with exactly one wavelength of motion and time how it rings. Every atom then contributes, and one run gives the speed to about 1–1.5%.
2. What each model assumes
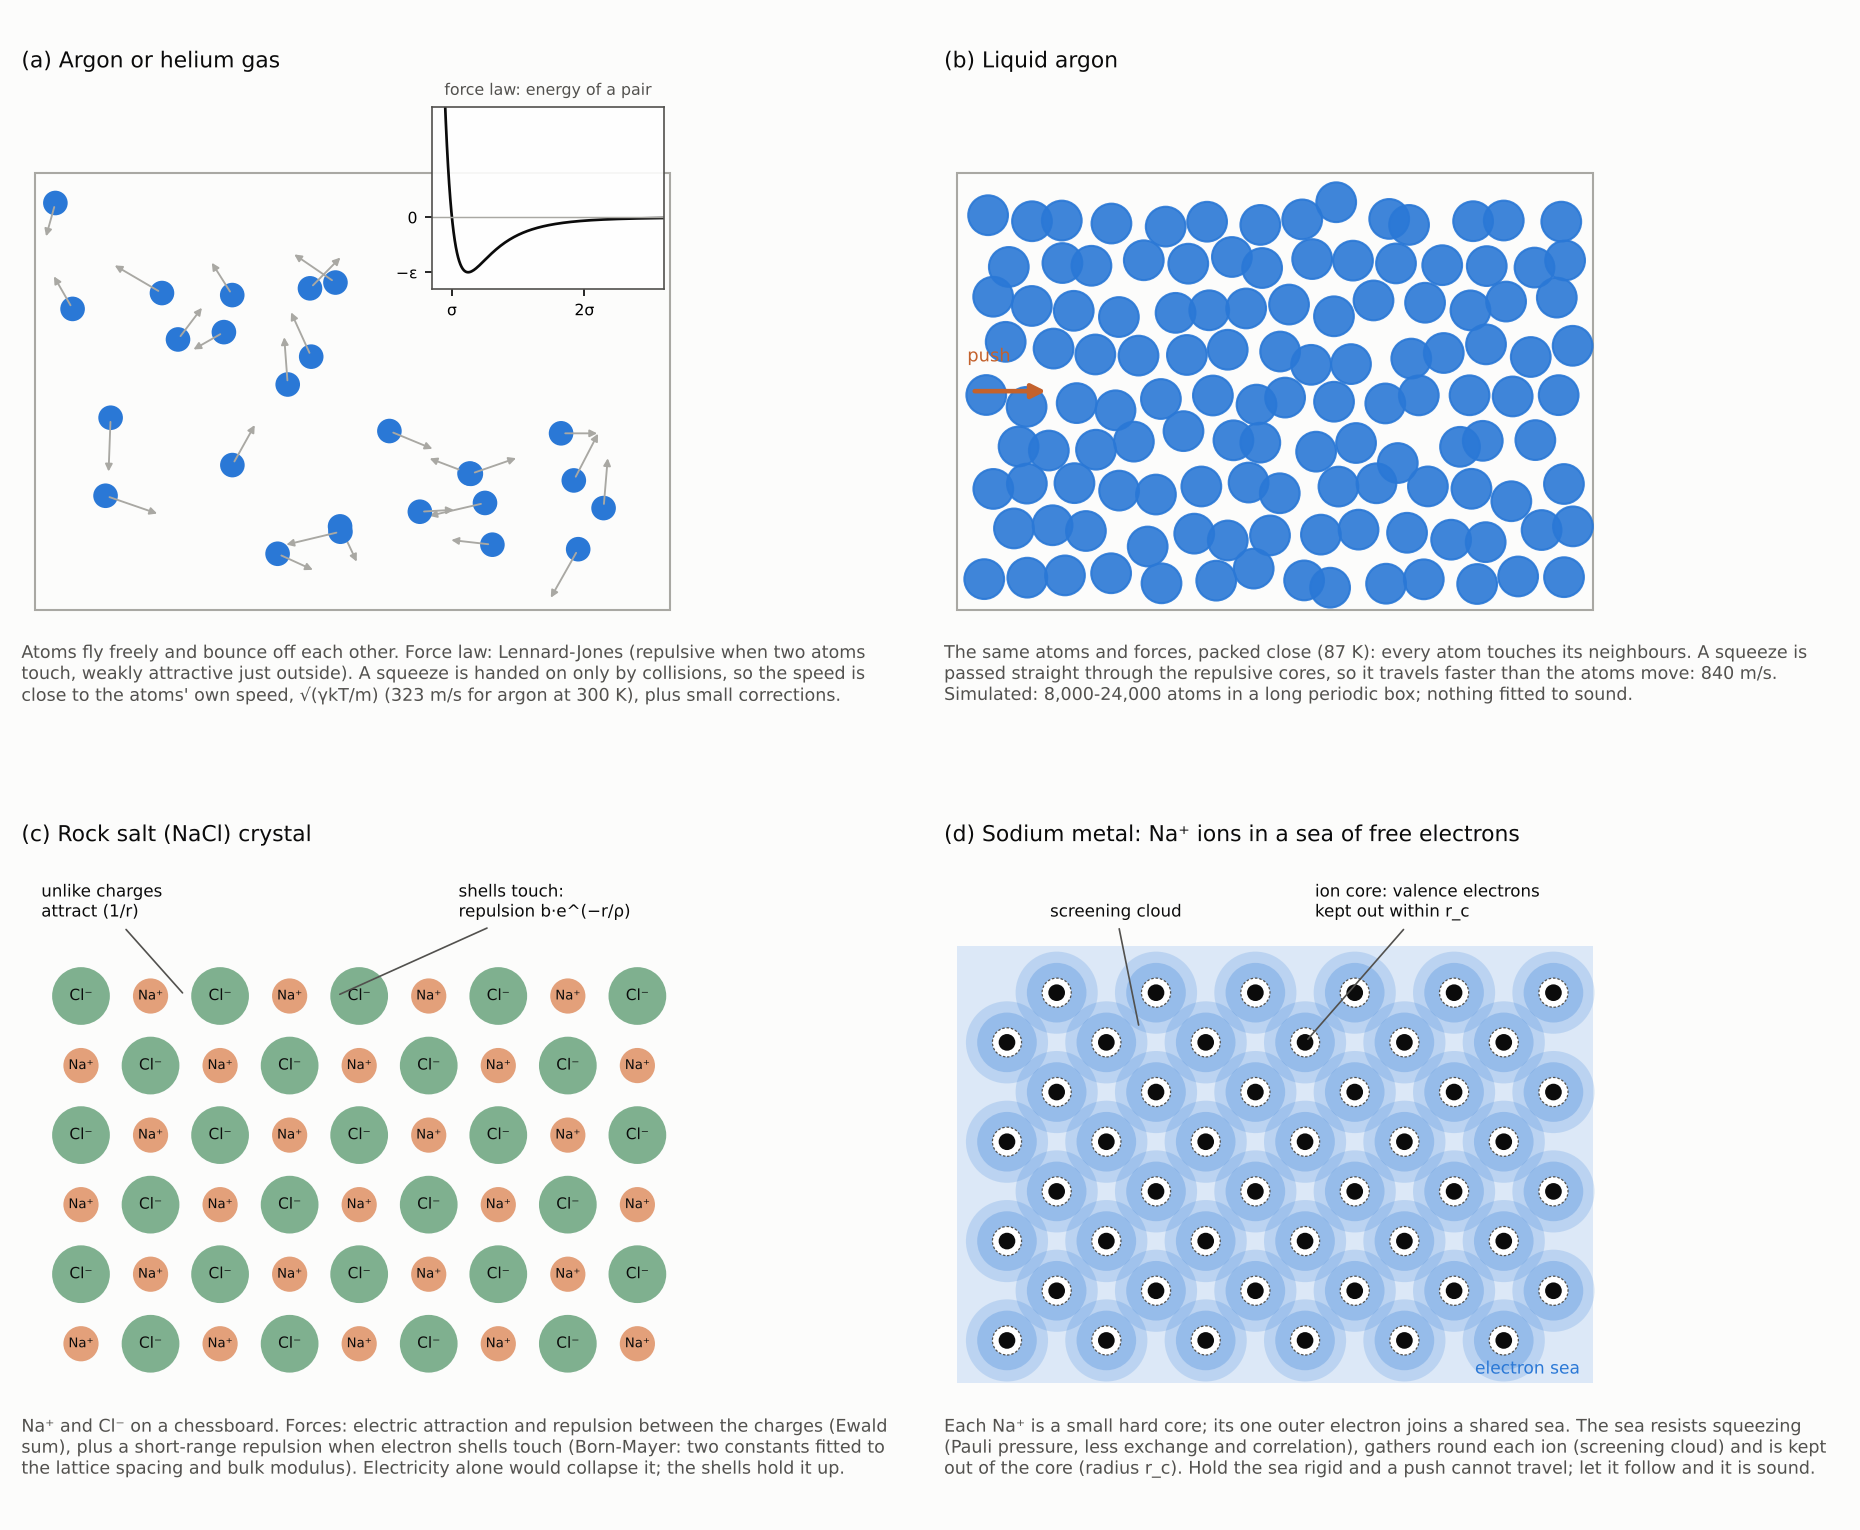
Figure 2. (a) Gas: atoms in free flight. (b) Liquid: the same atoms packed close. (c) Rock salt: ions held by electric forces and kept apart by their electron shells. (d) Sodium: hard ion cores in a sea of free electrons that gathers round each ion.
- Gases and liquid argon. Atoms attract weakly at a distance and repel hard up close (the Lennard-Jones force law). Its two numbers come from how the real gas departs from an ideal gas.
- Rock salt. Positive and negative ions on a cubic grid, held by electric forces, with a short-range repulsion from their electron shells. Two measurements fix that repulsion: the spacing of the ions and how much the crystal squeezes under pressure. Its sideways (shear) wave speeds are then outright predictions.
- Sodium. Sodium ions sit in a sea of free electrons. When the ions are squeezed together, the electrons follow and partly cancel their charge, and the push travels as sound.
3. Sodium: why a metal is hard
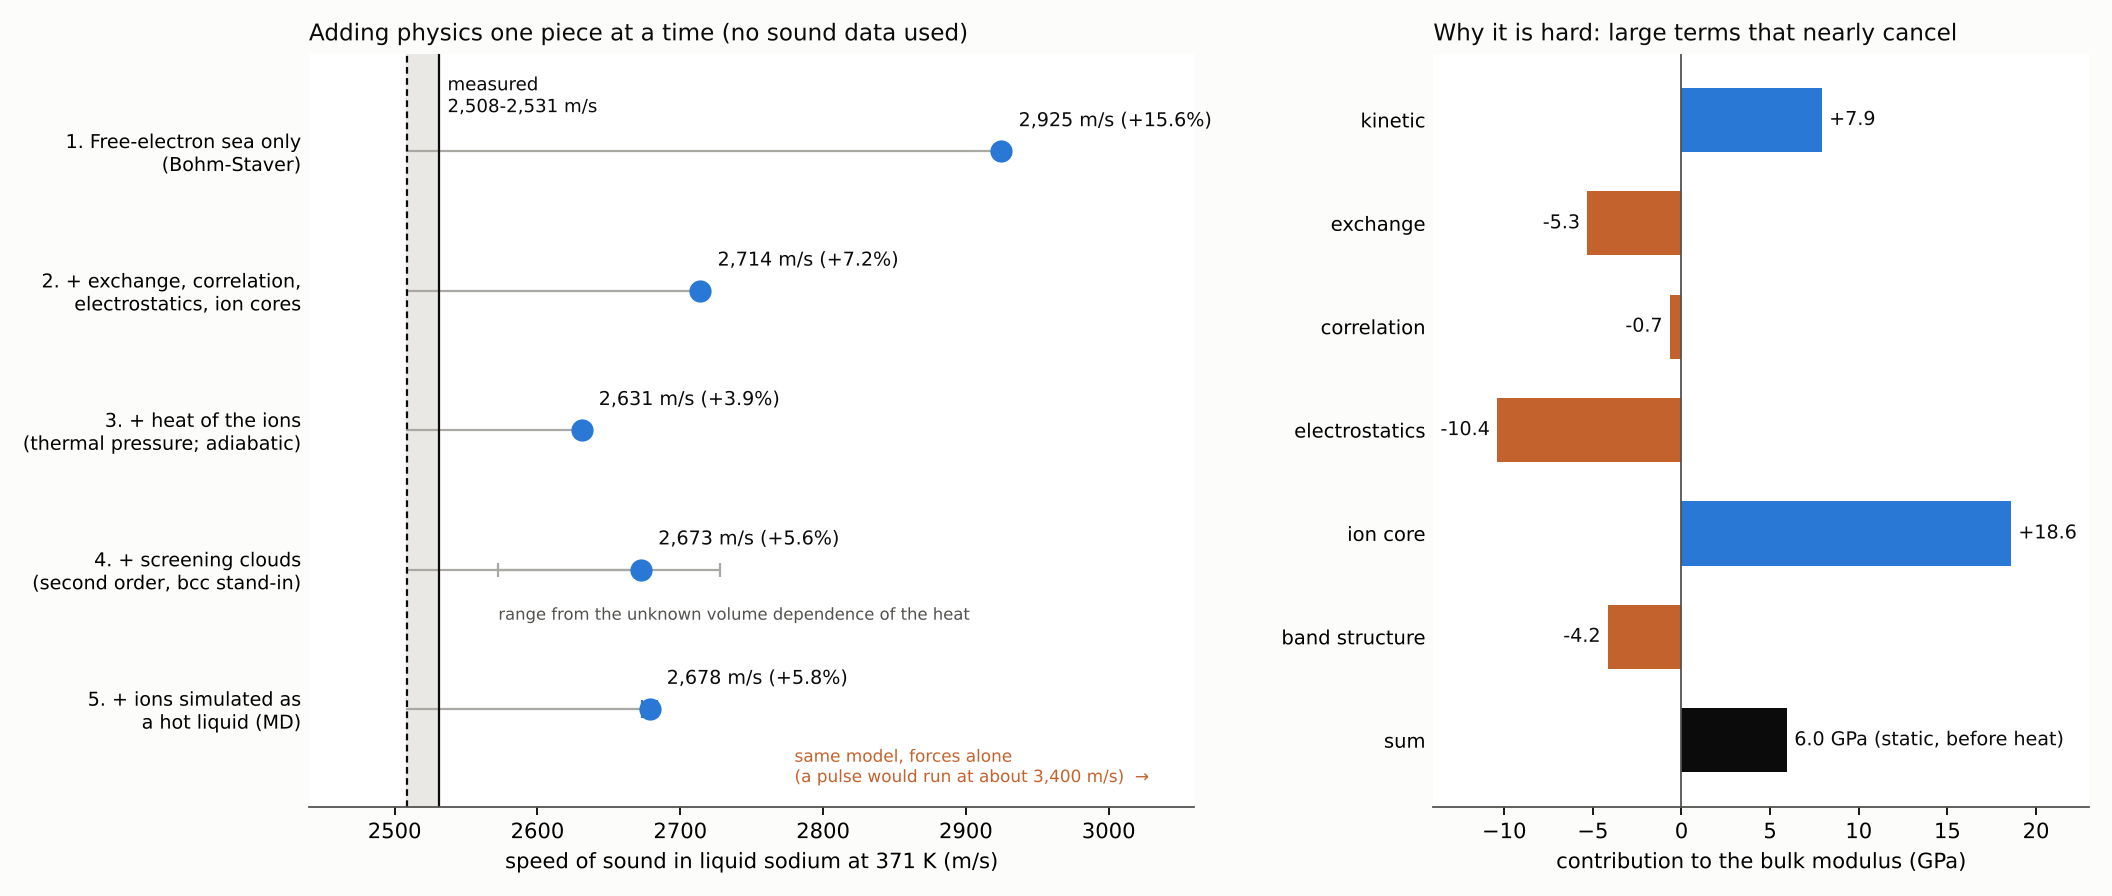
Figure 3. Left: the speed of sound in liquid sodium at 371 K as each piece of physics is added; no sound data are used at any step. Grey band: the two standard measured values. Right: the contributions to the stiffness.
-
A small difference between large numbers. Sodium’s stiffness against squeezing is about 6 GPa. That is what remains when large terms nearly cancel:
- +7.9 GPa from the electrons’ motion;
- −5.3 and −0.7 GPa from two quantum effects among the electrons;
- −10.4 GPa from the electric forces;
- +18.6 GPa from the ion cores;
- −4.2 GPa from the clouds of electrons gathered round each ion.
-
Step by step. Adding each piece brought the speed down from 16% high to 6% high. In the last step, 2,000 ions were simulated as a real hot liquid.
-
Could we get within half a standard deviation of the measurement? Not from first principles today:
- the two standard measurements disagree with each other by 0.9%;
- the best published computer simulations agree with measurement to about 2.5%;
- our own model fails a consistency check: the stiffness its forces carry is 1.6–1.7 times the stiffness its energy gives. Real sodium has only one stiffness.
A realistic goal is a few percent.
4. What carries over to Aspden’s aether
Animation: the sodium crystal, pushed (MP4)
The animation shows the same sodium crystal twice, seen side-on, with the same push at the left. Top: the electron sea held rigid, as Aspden’s continuum is. The first layer of ions rings in place, 7 trillion times a second, and nothing reaches the other layers. Bottom: the electrons free to follow. The squeeze runs to the right as sound. Ion positions are from the simulations; the squeeze is drawn a few thousand times stronger than in loud ultrasound so that it can be seen.
- A push needs a background that can follow. Hold sodium’s electron sea rigid, as Aspden’s continuum is held, and a push only rings in place; it never travels. Let the electrons follow the ions, and the push becomes ordinary sound.
- Energy and forces must agree. Any model of the aether should give the same wave speed whether it is worked out from its energy or from its forces. Our sodium model fails that test, and the test is cheap to run, so every aether model should be put through it.
- A crystal of charges needs a short-range repulsion. Electric forces alone make rock salt collapse; the repulsion of its electron shells holds it up. Aspden’s grid of quons has no such repulsion.
Files
- sound_scripts.zip: every simulation and figure script, with its output.
- Companion: Testing Harold Aspden’s Aether Physics Against Modern Measurements, the working paper.